Introduction
Introduction#
As of Weka version >3.5.2 one can easily add visualization plugins in the Explorer (Classify panel). This makes it easy to implement custom visualizations, if the ones Weka offers are not sufficient.
Note: This is also covered in chapter Extending WEKA of the WEKA manual in versions later than 3.6.1/3.7.0.
Requirements#
- custom visualization class must implement the following interface
weka.gui.visualize.plugins.VisualizePlugin - the class must either reside in the following package (visualization classes are automatically discovered during run-time)
weka.gui.visualize.plugins - or the class' package must be listed in the
weka.gui.visualize.plugins.VisualizePluginkey of the[weka/gui/GenericPropertiesCreator.props](weka_gui_genericpropertiescreator.props.md)file (only available in 3.5.7 or later).
Implementation#
The visualization interface contains the following four methods
- getMinVersion
This method returns the minimal version (inclusive) of Weka that is necessary to execute the plugin, e.g.,
3.5.0. - getMaxVersion
This method returns the maximal version (exclusive) of Weka that is necessary to execute the plugin, e.g.,
3.6.0. - getDesignVersion
Returns the actual version of Weka this plugin was designed for, e.g.,
3.5.1 - getVisualizeMenuItem
The
JMenuItemthat is returned via this method will be added to the plugins menu in the popup in the Explorer. The ActionListener for clicking the menu item will most likely open a new frame containing the visualized data.
Examples#
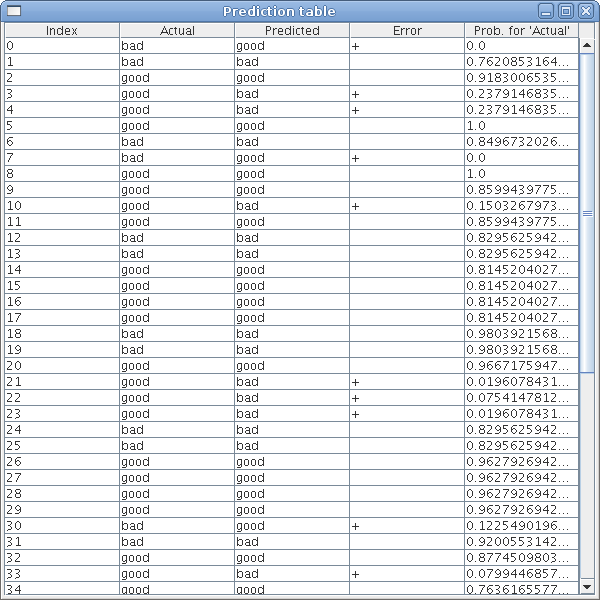
Table with predictions#
The PredictionTable.java example simply displays the actual class label and the one predicted by the classifier. In addition to that, it lists whether it was an incorrect prediction and the class probability for the correct class label.
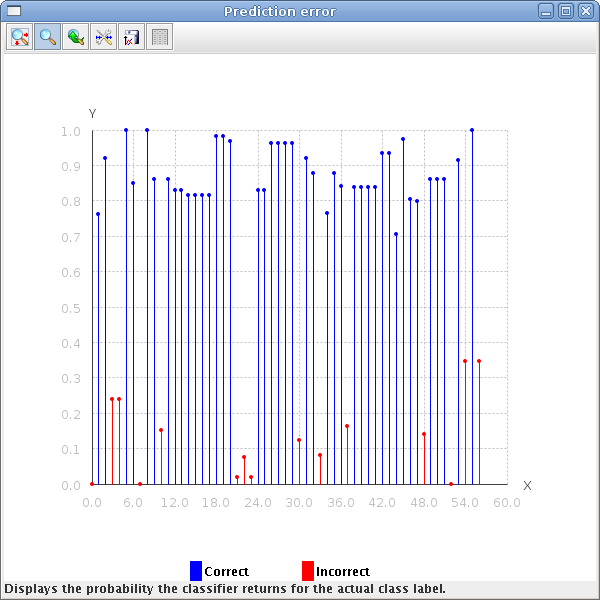
Bar plot with probabilities#
The PredictionError.java to display a simple bar plot of the predictions. The correct predictions are displayed in blue, the incorrect ones in red. In both cases the class probability that the classifier returned for the correct class label is displayed on the y axis. The x axis is simply the index of the prediction starting with 0.
Downloads#
See also#
- Use Weka in your Java code - general overview of the basic Weka API
- Explorer visualization plugins