Roc curves
General#
Weka just varies the threshold on the class probability estimates in each case. What does that mean? In case of a classifier that does not return proper class probabilities (like SMO with the -M option, or IB1), you will end up with only two points in the curve. Using a classifier that returns proper distributions, like BayesNet, J48 or SMO with -M option for building logistic models, you will get nice curves.
The class used for calculating the ROC and also the AUC (= area under the curve) is weka.classifiers.evaluation.ThresholdCurve.
Commandline#
You can output the data for the ROC curves with the following options:
 -threshold-file <file>
        The file to save the threshold data to.
        The format is determined by the extensions, e.g., '.arff' for ARFF
        format or '.csv' for CSV.
 -threshold-label <label>
        The class label to determine the threshold data for
        (default is the first label)
Here's an example for using J48 on the UCI dataset anneal, generating the ROC curve file for label U from a 10-fold cross-validation:
 java weka.classifiers.trees.J48 -t /some/where/anneal.arff \
      -threshold-file anneal_roc_U.arff -threshold-label U
Explorer#
Generating#
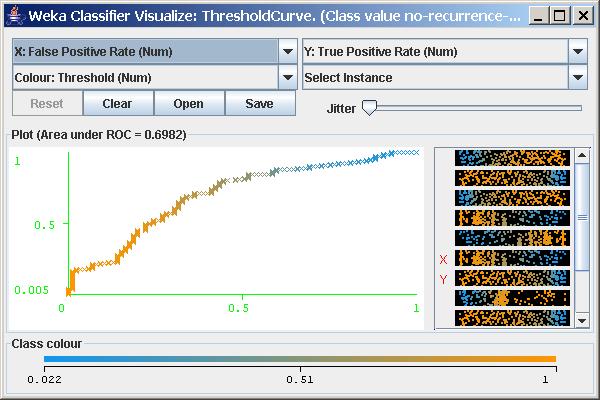
The Weka Explorer enables you to plot the ROC (Receiver operating characteristic) curve for a certain class label of dataset:
- run a classifier on a dataset
- right-click in the result list on the result you want to display the curve for
- select Visualize threshold curve and choose the class label you want the plot for
Note: the AUC for this plot is also displayed, just above the actual plot.
Saving#
You can save the ROC curve in two ways:
- as an ARFF file, containing the data points (can be displayed again)
- as an image (using Alt+Shift+Left click to bring up a save dialog)
Loading#
A previously saved ROC data file can be displayed in two ways:
KnowledgeFlow#
See Plotting multiple ROC curves.